Power of Aggregators

Aggregators or two-sided marketplaces are a profitable business model. There are a lot of startup pitches that start with ‘we are building Uber for x or Airbnb for y’. There is no doubt that aggregators can become incredibly valuable, profitable, and powerful. However, building an aggregator is not easy. Understanding how aggregators work and what it takes to build a successful aggregator is essential.

Before digging deeper, we start with breaking down what are the competitive advantages of aggregators by examining the aggregation theory. In 2015, Ben Thomson defined aggregation theory as follows:

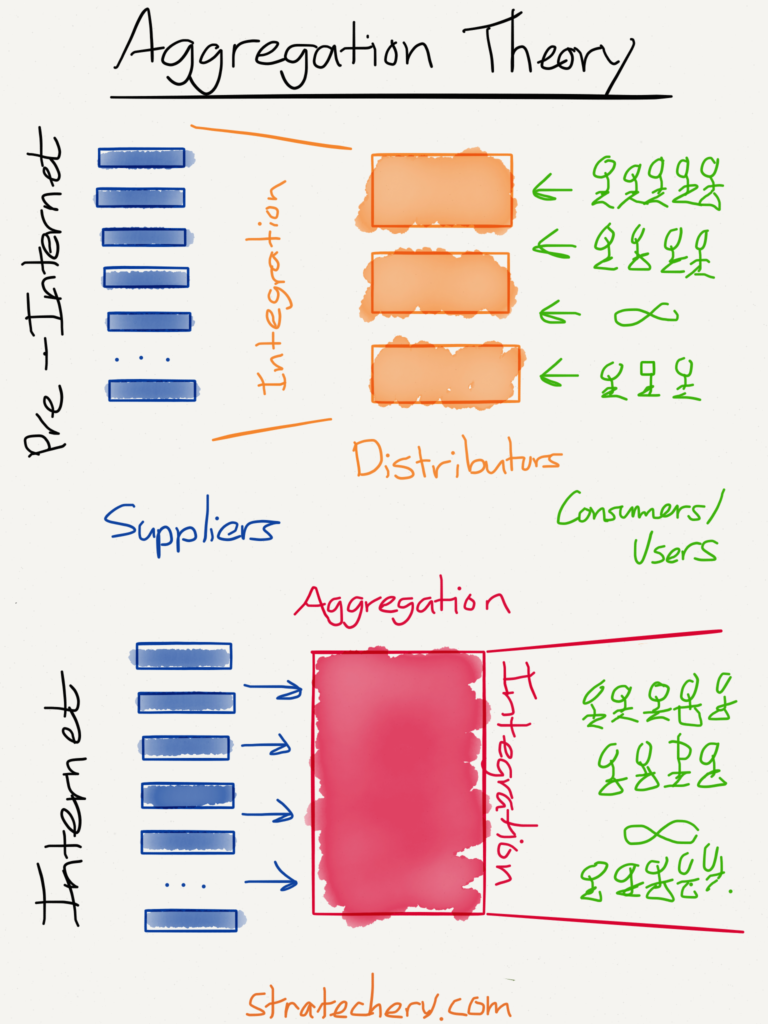
The value chain for any given consumer market is divided into three parts: suppliers, distributors, and consumers/users. The best way to make outsize profits in any of these markets is to either gain a horizontal monopoly in one of the three parts or to integrate two of the parts such that you have a competitive advantage in delivering a vertical solution. […]

The fundamental disruption of the Internet has been to turn this dynamic on its head. First, the Internet has made distribution (of digital goods) free, neutralizing the advantage that pre-Internet distributors leveraged to integrate with suppliers. Secondly, the Internet has made transaction costs zero, making it viable for a distributor to integrate forward with end users/consumers at scale.

This has fundamentally changed the plane of competition: no longer do distributors compete based upon exclusive supplier relationships, with consumers/users an afterthought. Instead, suppliers can be aggregated at scale leaving consumers/users as a first order priority. By extension, this means that the most important factor determining success is the user experience: the best distributors/aggregators/market-makers win by providing the best experience, which earns them the most consumers/users, which attracts the most suppliers, which enhances the user experience in a virtuous cycle.

By this definition, a considerable number of today’s prominent technology companies can be classified as aggregators. They became very successful by automating distribution, and instead of aggregating suppliers, focused directly on providing the best end-user experience. Here are a few examples:

  • Facebook: Aggregating content from users’ friends and advertisements and making them available to other users;
  • Airbnb: Aggregating vacant rooms globally and providing an interface for consumers;
  • MoneySuperMarket.com: Aggregating UK insurance products and selling them to UK consumers;
  • AutoTrader: Aggregating UK car sales listings for UK consumers; and
  • Google: Aggregating free content from the web and making it searchable for consumers.

Aggregation theory explains how successful tech giants think. It also serves as a warning to industries who are still based on controlling distribution. There are three key types of aggregators. Each type is determined by the cost/effort of scaling supply and demand and cadence of usage by consumers. Let’s look at a few examples to make it clear.

Micro Aggregators

Micro aggregators must spend a significant amount of time and money to integrate different suppliers into their platform and have excessive costs attracting customers. Often, they must build a relationship with each individual supplier and integrate them into the platform. Moreover, the integration effort is not repeatable for other suppliers, and each supplier requires its own integration effort.

A good example of this kind of aggregator is MoneySuperMarket.com or comparethemarket.com, which are insurance comparison sites. They must build a relationship with every insurance provider and integrate them individually to their platform. Integrating a new insurance provider requires the same amount of integration work.

Scaling demand is also not cheap for these kinds of aggregators. Due to the fierce competition in the space and the lack of differentiation, these firms have a very high cost of customer acquisition. For example, UK price comparison websites spend £48 on average to get a consumer to their website. The other important dynamic of these aggregators is how often people use them. For example, for UK price comparison websites, this is only a few times a year.

Still, these aggregators can be very profitable and very successful. However, there is a limit to how much they can grow. Apart from the above points, another growth limitation factor is legislation. For these aggregators to enter a new market (usually a new country), they need to adhere to new rules and regulations and build new relationships with new suppliers.

Global Aggregators

Global aggregators incur significantly less costs when bringing on new suppliers to their platform; however, they still have high customer acquisition costs. The process of bringing on new suppliers is repeatable. Uber and Airbnb are examples of global aggregators. Once the platform is up and running, the cost of adding a new driver or a new house or even a new city is not much when compared to the cost of building the platform.

The cost of acquiring customers is still noticeable; however, these customers come back to these platforms multiple times a year, and in the case of Uber, multiple times a week. As we can see with Uber and Airbnb, these aggregators can be global dominators.

Super Aggregators

Super aggregators do not incur any costs to obtain suppliers and consumers. Google, Facebook, and Instagram are examples of super aggregators. In the case of Google, their supply is web content and advertisements. Web content is freely available to everyone, and they have an automated and scalable process for onboarding advertisers to their platform. Facebook’s supply comes for free from our photos, videos, status updates, and content that we share from the media. They use the same strategy as Google for scaling advertisers on their platform.

Super aggregators have zero customer acquisition costs, as they are highly differentiated and have monopolies in what they do. With consumers often using these platforms multiple times a day, there is almost no limit on how big supper aggregators can become, and that is why Facebook and Google are two of the most valuable companies in the world.

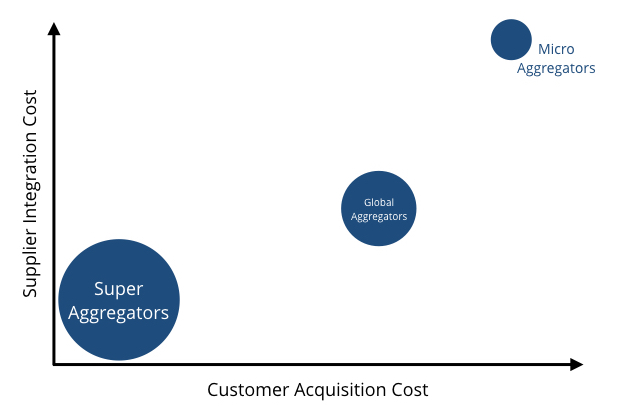
Market valuation of aggregators is a function of the cost of customer acquisition and supplier integration.

The Internet takes away the cost of distribution. Essentially, everyone can become their own distributor by putting up a website or a mobile app and reaching out to end users. However, in an increasingly fragmented web ecosystem, discoverability becomes a big problem.

This is why aggregators can be very profitable and valuable. They do not create goods, services, or content. However, they provide the best user experience for consumers to discover and use goods, services, or content. To that end, suppliers have no choice but to partner with these aggregators for distribution.

Parallels of Art Making and Software Development

I used to paint many years ago, and I loved it. In the last few years I have not really touched my brush. Last year when I wanted to get back to running after an eight-month break, Haruki Murakami’s fantastic book, What I Talk About When I Talk About Running helped me to get back to it.

FullSizeRender.jpg

My last painting. November 2005

A few weeks ago I decided to start painting again and started reading Art & Fear: Observations on the Perils (and Rewards) of Artmaking by David Bayles and Ted Orland. This is a book about the way ordinary art gets made, the reasons it often doesn’t get made, and the difficulties that cause so many artists to give up along the way.

What I love about this book is that it uses art to talk about life. You can apply its lessons to almost anything. While reading it, I could not stop thinking about the parallels between art making and the “craft” of software development.

The writers talk about fear of failure, imagination, vision, execution, and joys of building something that only exists in your imagination in the face of uncertainty. They explore artwork’s life cycle, and to me, it was very similar to the life cycle of a software product. “Imagination is in control when you begin making an object. The artwork’s potential is never higher than in the magic moment when the first brushstroke is applied, the first chord struck.”

This is very true whenever we start a new software project. We always strive to build a product with best product/market fit. We want to it to be the most organized, well-written, loosely coupled, highly cohesive code base ever. The imagined code base in our heads is always perfect. The thought-up product is always the best fit for the market. However, problems begin when we humans have to implement it in our imperfect ways. “Finally, at some point or another, the piece could not be other than it is and it is done. That moment of completion is also, inevitably, a moment of loss—the loss of all the other forms the imagined piece might have taken.”

We can never get it to perfect at the outset form, but we move it closer and closer with each round of releasing, testing, and refactoring. After all, “to demand perfection is to deny your ordinary (and universal) humanity, as though you would be better off without it.”

Perhaps the single most important trait of a team building high-quality, fit-for-market software product is the concept of iteration—and its associated learning. In lean cycles we know this as the build, measure, and learn loop.

There is a famous story in the book that resonates nicely with this concept:

The ceramics teacher announced on opening day that he was dividing the class into two groups. All those on the left side of the studio, he said, would be graded solely on the quantity of work they produced, all those on the right solely on its quality.

His procedure was simple: on the final day of class he would bring in his bathroom scales and weigh the work of the “quantity” group: fifty pound of pots rated an “A”, forty pounds a “B”, and so on. Those being graded on “quality”, however, needed to produce only one pot –albeit a perfect one– to get an “A”.

Well, it came grading time, and a curious fact emerged: the works of highest quality were all produced by the group being graded for quantity. It seems that while the “quantity” group was busily churning out piles of work – and learning from their mistakes –the “quality” group had sat theorizing about perfection, and in the end had little more to show for their efforts than grandiose theories and a pile of dead clay.

This story is the best way to explain the build, measure, and learn loop. You have to build many times and release many times to get better at the releasing software. The story echoes nicely with one the most important principles of continuous delivery. If something is difficult or painful, do it more often.

To me the most important phase of the loop is learning for from your work. “Art is like beginning a sentence before you know it’s ending. The risks are obvious: you may never get to the end of the sentence at all—or having gotten there, you may not have said anything.” Building software is very expensive, and it is important to take steps to reduce risks. And this is where learning becomes useful. We should use this learning constantly to course correct and make sure that we build a product that actually says something!

I have yet to start painting again. But I really enjoyed this book. I’m sure at some point I will paint again.

How Did Humans Become Masters of the Earth?

I have recently finished reading Sapiens, A Brief History of Humankind. The book tries to tell the entire story of us, Homo sapiens (Latin for “wise person”), in 450 pages. It was one of the most thought-provoking books I have ever read. Yuval Harari’s articulate writing takes you back 2 million years and slowly brings you back to present day. Throughout this journey this book changes your mental model of the world we live in.

One hundred thousand years ago we were just one of half a dozen human species all competing for survival. Today we are the only species alive. The book gives a horrific account of our struggles on our path to supremacy. For the first half of our existence, we were an animal of no significance; “The most important thing to know about prehistoric humans, is that they were insignificant animals with no more impact on their environment than gorillas, fireflies or jellyfish”, Harari writes.

However in second half of our story, we undergo a series of revolutions that continues to this day. The “cognitive” revolution about 70,000 years ago is the first. We start behaving in far more ingenious ways than before, and we spread rapidly across the planet. Harari argues that cognitive revolution gave us an edge over other human species.

What has made us so successful is that we are the only animals that are capable of large-scale cooperation. We know how to organise ourselves as nations, companies, and religions, giving us the power to accomplish complex tasks. What’s unique about Harari’s take is that he focuses on the power of stories and myths to bring people together. Baboons, wolves, and other animals also know how to function as a group, of course, but they are defined by close social ties that limit their groups to small numbers. Homo sapiens have the special ability to unite millions of strangers around common myths.

In an interesting thought experiment, imagine one human and one chimpanzee stuck on an island fighting for survival. I would put my money on the chimpanzee. The chimp would easily overpower the human. However, if we have 1,000 humans and 1,000 chimpanzees, there is a very good chance that the humans would win the fight for survival. One thousand chimps can’t cooperate. One thousand humans can. And we are only powerful if we work together in large groups.

The reason that 1,000 humans can cooperate and chimpanzees can’t is simply because humans can come together around myths, legends, and stories. As long we believe in the same story, we follow the same rules and hold same values. If you ask a chimpanzee to give you its banana in return for going to chimpanzee heaven where it can have unlimited bananas in return for its good deed, it would never believe you. However, Homo sapiens easily believe in these imaginary stories and work together on building cathedrals and waging crusades. Ideas like freedom, human rights, gods, laws, and capitalism exist in our imaginations, yet they can bind us together and motivate us to cooperate on complex tasks.

About 11,000 years ago we entered the agricultural revolution era, converting in increasing numbers from hunting and gathering to farming. Harari sees the agricultural revolution as “history’s biggest fraud.” It is very discomforting to think that “we did not domesticate wheat. It domesticated us.” More often than not it provided a worse diet, longer hours of work, greater risk of starvation, crowded living conditions, and greatly increased susceptibility to disease. Harari thinks we may have been better off in the Stone Age.

The scientific revolution begins about 500 years ago. It triggered the Industrial Revolution about 250 years ago, which triggered in turn the Information Revolution about 50 years ago. He argues that this could be the biggest revolution of all. It may be able to alter the course of human evolution and lead to new human species in future.

The final section of the book is especially interesting. After going through thousands of years of history, the author turns to the future and wonders how artificial intelligence, genetic engineering, and other technologies will change our species.

I did not agree with all of Harari’s arguments. However, I would highly recommend this book to anyone interested in early human history. Once you start reading, it is hard to put it down, and certainly it will spark interesting conversations with your favourite Homo sapiens.

Evolving Software Delivery using Continuous Measurement

Software development is complex, expensive and time-consuming. Every business wants to get the highest return on projects, yet success remains typically grounded in meeting one’s schedule, scope and budget. We argue that different metrics, focused on the business outcomes of the delivered software, are more realistic measures of success.

Over the last year, we have worked closely with a number of clients to explore different methods of measuring success based on outcomes over output. Outcomes and output are both important, albeit to measure different things. Output is a productivity measure, and outcome is a business measure. We experimented with methods to embed regular quantitative and qualitative measurement into the software development process to measure money earned rather than just story points. We regularly defined and used different business metrics at a story level to get fast feedback against initial goals. Business metrics were also used at a macro level for project governance.

Wrong Measures of Success

Often, we find a project is deemed successful if it delivers all features on time and on budget. However, is a project still successful if it delivered minimal business value? Studies have shown that more than 50% of functionality in software is rarely or never used. That is potentially 50% of resources wasted. Going back to original question, does it matter if something was delivered on time if it won’t be fully utilized?

IT projects regularly focus too heavily on their constraints instead of the value they are delivering. Scope, schedule and costs are easily understood and calculated, but benefits, if measured at all, are usually broad and non-specific. For example, project teams regularly report velocity and burn-up to stakeholders instead of the value they are delivering. Constraints are important, and teams should track them on a regular basis, but they shouldn’t be a measure of success.

Changing the Definition of “Done”

In order to measure a project’s success based on the value it delivers instead of its constraints, we had to challenge our established way of working. Traditionally, a feature is considered complete when it has passed all testing and is in production. We questioned this approach and did not count a feature as complete until we had measured its outcomes and learnt from it.
To implement this, we extended our Agile Story Wall and put a column labelled “Measured and Validated” to the right of the “Live” column, which is typically the end of the lifecycle. Adding this to the story wall meant the story was visibly incomplete until we had measured the effect of the feature. Therefore, when a story went live, it was still not complete on the story wall until it had been measured. Consequently, the team became focused on the outcome the story was delivering and not just getting the story live. The whole mindset shifted from delivering features to delivering measurable outcomes.

agile_storywall

Hypothesis Driven Development

By changing the definition of done, our efforts evolved from delivering what stakeholders thought was the highest priority story, to an experiment to see if the feature delivered value or not. However, the next problem we encountered was validating the story’s value against the initial goals and purpose.

Hypothesis Driven Development solved this problem. Hypothesis development is derived from the scientific method. For every experiment, a person must make a hypothesis of what is expected to happen, based on research and findings. Afterwards, the experiment’s outcomes are measured against the initial hypothesis to see if it was correct or not.

We adopted a new User Story template to represent the story now being an experiment.  Initially, the most common user story template was:

As a <type of user>,

I want <some goal>,

so that <some reason>.

However, a user story template to support Hypothesis Driven Development would be:

We believe that <this capability>

Will result in <this outcome>;

We know we have succeeded when <we see this measurable signal>.

Capability represents what feature we will develop. Outcome refers to the specific business value expected by building the feature. Measurable signal include  the indicators that will illustrate whether the feature built has met the outcome expected. These are qualitative or quantitative metrics that will test the hypothesis in a defined time period.

Hypothesis and measurable signal are determined based on existing business data, persona-driven research, user testing, domain expertise, market analysis and other information. Some examples are:

Capability

Outcome

Measurable Signal

Moving the filter bar to the top of the search results

increased customer engagement

usage of the filter bar increases by 5% within 5 days.

Adding more details link to product page

better communication with customers

1% increase in conversion

Each story was measured, once it went live, to gauge its performance against the measurable signal. The results fed back into our product development cycle and influenced future hypotheses and remaining priorities. If a particular change in one part of our application produced unexpected results, we could apply that new real-world data point to other parts.

Fast Feedback Cycle

Continuously measuring at a story level against defined hypotheses enabled a fast feedback cycle and quick learning. If a story under-performed against the hypotheses, it either went back into the pipeline to be improved based on our new learning or was rolled back. All learning that arose from this process, positive or negative, was critical to the formation of new hypotheses, subsequent story creation, and prioritisation.

Measuring business outcomes gives a development team a foundation for “failing fast” when a hypothesis literally doesn’t measure up to expectations. By constantly measuring the impact of stories, a team can quantify trends and determine when decreasing return on investment means a project should pivot.

One Common Objective

As a result of this continuous measurement process, the development team’s focus is shifted from delivering software to a particular specification to delivering business oriented outcomes. This fundamentally aligned software delivery with business strategy and objectives.

Reporting the business measures and outcomes of the stories creates a shared understanding and improved communication among development team members. Specifically, they are able to more effectively communicate what has been delivered. Additionally, business executives can now understand the benefit of what has been delivered and become an advocate for IT.

Continuous Delivery, Design and Measurement

Continuous Delivery infrastructure and Continuous Design processes enable teams to measure quickly and respond to new insights quickly. Continuous Delivery gives teams the ability to deliver frequently and get fast feedback at the push of a button. Continuous Design is the process of regular improvement and evolution of a system as it is developed, rather than specifying the complete design before development starts.

Continuous Delivery Design and Measurement

While Continuous Delivery lets us rapidly release features, Continuous Design enables us to iteratively adapt the design. Combining these with Continuous Measurement will evolve software delivery. Continuous Measurement and learning is the missing link to this powerful combination, as it enables us to ensure we are building software that meets the business goals.

Continuous Measurement at the Macro Level

Continuous Measurement can also be applied to track macro-level progress towards key performance indicators.  This is similar to a traditional burn-up chart, which tracks story points to a target. Knowing that business outcomes are important, as opposed to story points, we decided to focus the burn-up towards our key goal. As an example, if the overall goal of the project is to increase conversion, a burn-up chart could be reported on an iterative basis, illustrating the progress towards the project goal.

This adjusted burn-up chart, showing progress in business terms, is more relevant and understandable across the organisation. The concept can be applied to any sector or industry, using different metrics that are relevant to the business situation and project goal.

Application to a New Software Product

The Continuous Measurement approach discussed is applicable for existing software applications, where one can use Continuous Delivery and design to get new features live as soon as possible. This enables Continuous Measurement of the outcomes against the hypotheses.

For a greenfield software project, other techniques (e.g., usability testing) are available to measure potential outcomes and validate hypotheses before the first release. New learning may lead to hypotheses of higher value stories to pursue, or may lead the team to “fail fast” without further investment, cutting losses as compared to a lengthy period of analysis. In any case, measures should be applied at a granular level over the course of the project and not only at the end.

Conclusion

For software projects to be deemed successful, it is important to measure the business impact that the software has achieved and not just use traditional measures of schedule, scope and budget. In order to do this, Continuous Measurement should be an integral part of the software development process.

Each story should have an expected outcome that can be measured and validated within a certain time period. Validating outcomes will generate new insights, which should be incorporated into a fast feedback cycle and influence future development. Tracking the success of the project can be achieved by introducing macro-level burn-up towards key business performance indicators.

This process results in a shared understanding that will shift the focus to align software delivery with business strategy and objectives. Combining Continuous Design and Delivery with Continuous Measurement allows software projects to take a more outcome-focused approach that ensures business goals are not only met, but are also quantified.